| |
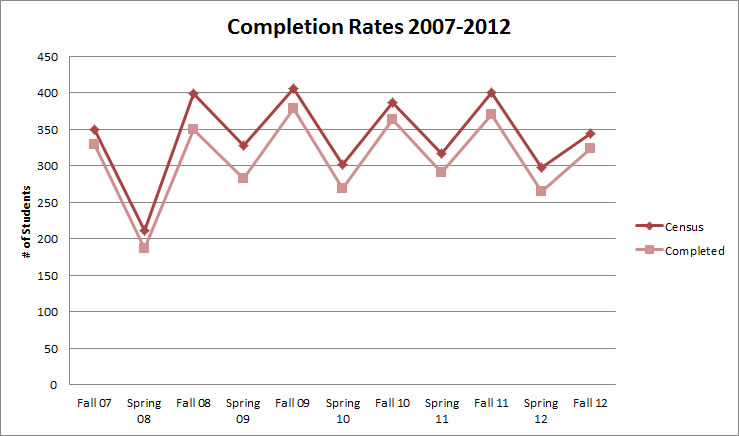
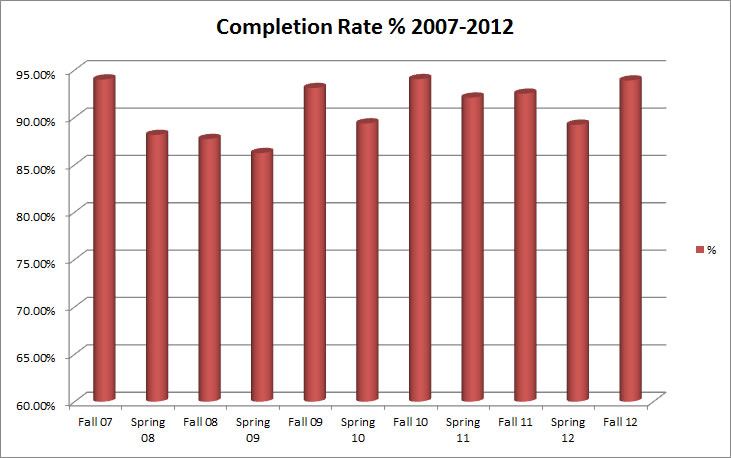
Completion Rate Data
| |
|
|
 |
Semester |
Census |
Completed |
% |
Fall 2007 |
350 |
329 |
94.00% |
Spring 2008 |
211 |
186 |
88.15% |
Fall 2008 |
399 |
350 |
87.72% |
Spring 2009 |
327 |
282 |
86.24% |
Fall 2009 |
406 |
378 |
93.10% |
Spring 2010 |
301 |
269 |
89.37% |
Fall 2010 |
386 |
363 |
94.04% |
Spring 2011 |
316 |
291 |
92.09% |
Fall 2011 |
400 |
370 |
92.50% |
Spring 2012 |
297 |
265 |
89.23% |
Fall 2012 |
344 |
323 |
93.90% |
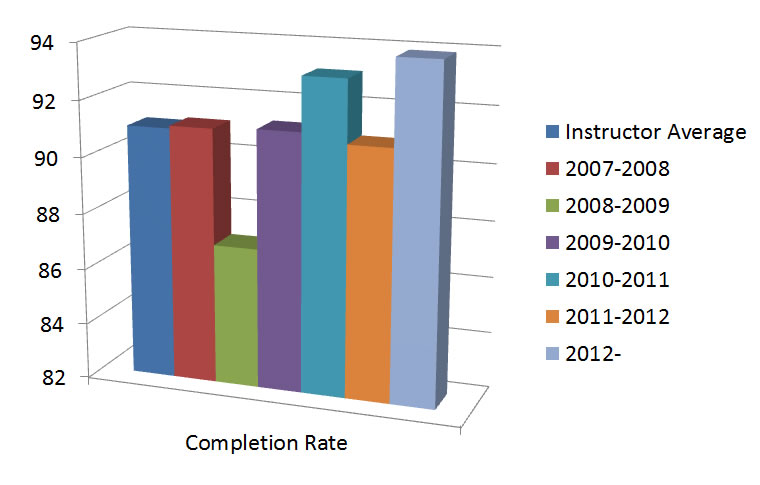
Completion Rate Graph
|
|
Achievement
Semester |
A |
F |
% score |
N |
Fall 2009a |
54 |
19 |
79.4 |
200 |
Fall 2009b |
47 |
18 |
79.7 |
206 |
Spring 2010a |
19 |
16 |
74.5 |
138 |
Spring 2010b |
28 |
24 |
74.3 |
163 |
Fall 2010a |
53 |
13 |
80.7 |
194 |
Fall 2010b |
51 |
15 |
80.5 |
192 |
|
| |
|
| |
|
| |
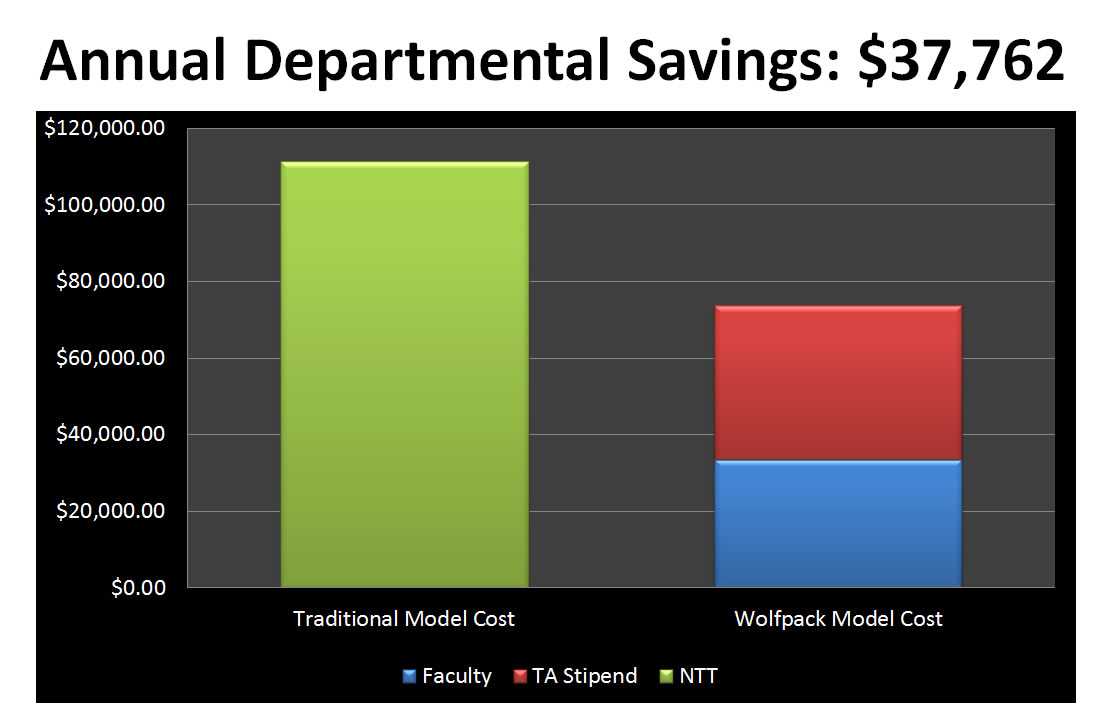
Departmental Savings (2010)
|
| |
Keys to Sucess ...
- Switch seats/rows after each hourly test (limit honor code issues)
- Separate instructor for fall and spring
- Talented and dedicated graduate teaching assistants
- Daily resource pages full of multimedia to use as needed
- Dynamic instructors with a sense of humor, and high expectations
- 5-7 activities in groups of two each day
- Groups-of-two “pop discussions” of difficult lecture points
- Weekly training sessions with the graduate teaching assistants
- TA ownership
- Limit effects of affective filter (feelings of learner anxiety)
|